A post hoc test performs a pairwise comparison between all available groups while controlling for the error rate.
Remember, we have confidence intervals and p-values to quantify our uncertainty. There’s always a small chance that we falsely reject the null hypothesis purely based on probability. Falsely rejecting the null hypothesis is sometimes referred to as Type 1 error. Typically, there’s a 5% chance we’ve rejected the null hypothesis when it was actually true.
But if we run a bunch of tests all with a 5% chance that we’re incorrectly rejecting the null hypothesis, the chance that we’ve made a mistake multiplies. The odds that we’ve made at least one mistake increases very rapidly the more tests we perform. Post-hoc ANOVA test control for that increasing probability.
One of the most common ANOVA post-hoc tests is the Tukey’s HSD, honestly significantly different. After performing ANOVA test, where we get statistically significant results, all we know is that at least one of the groups means are different. Tukey’s HSD test will then compare all the pairs of groups and determine which pairs are different from one another while controlling for the fact that we’re running multiple hypothesis tests all at once.
Imports
We’ll start by importing the statsmodels package and the ols function so we can construct a simple linear regression model. Next, we load in the dataset from the one-way ANOVA.
Note: Running a post hoc test on two-way ANOVA is a bit more advanced and outside the scope of this post.
# Import statsmodels package and ols function
import statsmodels.api as sm
from statsmodels.formula.api import ols
# Load in the data set from one-way ANOVA
diamonds = pd.read_csv("diamonds.csv")
One-way ANOVA
Here we follow the same steps as above:
- Build a simple linear regression model
- Check the results
- Run one-way ANOVA
# Construct simple linear regression model, and fit the model
model = ols(formula = "log_price ~ C(color)", data = diamonds).fit()
# Get summary statistics
model.summary()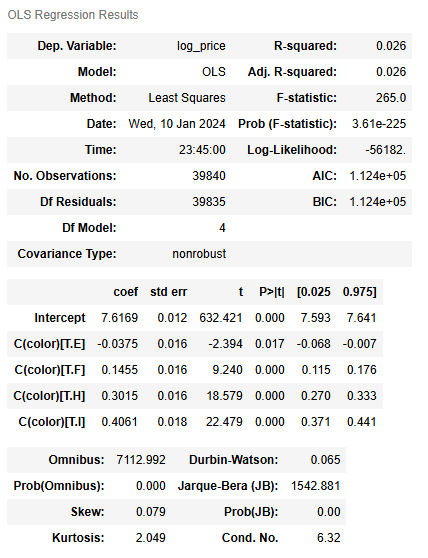
Warnings:
[1] Standard Errors assume that the covariance matrix of the errors is correctly specified.
Now that we have reconstructed the simple linear regression model, we can re-run the ANOVA.
# Run one-way ANOVA
sm.stats.anova_lm(model, typ=2)| sum_sq | df | F | PR(>F) | |
|---|---|---|---|---|
| C(color) | 1041.690290 | 4.0 | 264.987395 | 3.609774e-225 |
| Residual | 39148.779822 | 39835.0 | NaN | NaN |
Since the p-value is very small and we can reject the null hypothesis that the mean price is the same for all diamond color grades, we can continue on to run a post hoc test. The post hoc test is useful because the one-way ANOVA does not tell us which colors are associated with different prices. The post hoc test will give us more information.
Post hoc test
There are many post hoc tests that can be run. One of the most common ANOVA post hoc tests is the Tukey’s HSD (honestly significantly different) test. We can import the pairwise_tukeyhsd() function from the statsmodels package to run the test.
# Import Tukey's HSD function
from statsmodels.stats.multicomp import pairwise_tukeyhsd
Then we can run the test. The endog variable specifies which variable is being compared across groups, which is log_price in this case. Then the groups variables indicates which variable holds the groups we’re comparing, which is color. alpha tells the function the significance or confidence level, which we’ll set to 0.05. We’ll aim for the typical 95% confidence level.
# Run Tukey's HSD post hoc test for one-way ANOVA
tukey_oneway = pairwise_tukeyhsd(endog = diamonds["log_price"], groups = diamonds["color"], alpha = 0.05)
Lastly, we get the results of the test.
# Get results (pairwise comparisons)
tukey_oneway.summary()| group1 | group2 | meandiff | p-adj | lower | upper | reject |
|---|---|---|---|---|---|---|
| D | E | -0.0375 | 0.1171 | -0.0802 | 0.0052 | False |
| D | F | 0.1455 | 0.001 | 0.1026 | 0.1885 | True |
| D | H | 0.3015 | 0.001 | 0.2573 | 0.3458 | True |
| D | I | 0.4061 | 0.001 | 0.3568 | 0.4553 | True |
| E | F | 0.183 | 0.001 | 0.1441 | 0.2219 | True |
| E | H | 0.339 | 0.001 | 0.2987 | 0.3794 | True |
| E | I | 0.4436 | 0.001 | 0.3978 | 0.4893 | True |
| F | H | 0.156 | 0.001 | 0.1154 | 0.1966 | True |
| F | I | 0.2605 | 0.001 | 0.2145 | 0.3065 | True |
| H | I | 0.1045 | 0.001 | 0.0573 | 0.1517 | True |
Each row represents a pairwise comparison between the prices of two diamond color grades. The reject column tells us which null hypotheses we can reject. Based on the values in that column, we can reject each null hypothesis, except when comparing D and E color diamonds. We cannot reject the null hypothesis that the diamond price of D and E color diamonds are the same.
Test 1: D vs. E
H0 : priceD = priceE
The price of D and E color grade diamonds are the same.
H1 : priceD ≠ priceE
The price of D and E color grade diamonds are not the same.
Result: We cannot reject the null hypothesis that the price of D and E color grade diamonds are the same.
Test 2: D vs. F
H0 : priceD = priceF
The price of D and F color grade diamonds are the same.
H1 : priceD ≠ priceF
The price of D and F color grade diamonds are not the same.
Result: We can reject the null hypothesis that the price of D and F color grade diamonds are the same.
Test 3: D vs. H
H0 : priceD = priceH
The price of D and H color grade diamonds are the same.
H1 : priceD ≠ priceH
The price of D and H color grade diamonds are not the same.
Result: We can reject the null hypothesis that the price of D and H color grade diamonds are the same.
Test 4: D vs. I
H0 : priceD = priceI
The price of D and I color grade diamonds are the same.
H1 : priceD ≠ priceI
The price of D and I color grade diamonds are not the same.
Result: We can reject the null hypothesis that the price of D and I color grade diamonds are the same.
Test 5: E vs. F
H0 : priceE = priceF
The price of E and F color grade diamonds are the same.
H1 : priceE ≠ priceF
The price of E and F color grade diamonds are not the same.
Result: We can reject the null hypothesis that the price of E and F color grade diamonds are the same.
Test 6: E vs. H
H0 : priceE = priceH
The price of E and H color grade diamonds are the same.
H1 : priceE ≠ priceH
The price of E and H color grade diamonds are not the same.
Result: We can reject the null hypothesis that the price of E and H color grade diamonds are the same.
Test 7: E vs. I
H0 : priceE = priceI
The price of E and I color grade diamonds are the same.
H1 : priceE ≠ priceI
The price of E and I color grade diamonds are not the same.
Result: We can reject the null hypothesis that the price of E and I color grade diamonds are the same.
Test 8: F vs. H
H0 : priceF = priceH
The price of F and H color grade diamonds are the same.
H1 : priceF ≠ priceH
The price of F and H color grade diamonds are not the same.
Result: We can reject the null hypothesis that the price of F and H color grade diamonds are the same.
Test 9: F vs. I
H0 : priceF = priceI
The price of F and I color grade diamonds are the same.
H1 : priceF ≠ priceI
The price of F and I color grade diamonds are not the same.
Result: We can reject the null hypothesis that the price of F and I color grade diamonds are the same.
Test 10: H vs. I
H0 : priceH = priceI
The price of H and I color grade diamonds are the same.
H1 : priceH ≠ priceI
The price of H and I color grade diamonds are not the same.
Result: We can reject the null hypothesis that the price of H and I color grade diamonds are the same.
Disclaimer: Like most of my posts, this content is intended solely for educational purposes and was created primarily for my personal reference. At times, I may rephrase original texts, and in some cases, I include materials such as graphs, equations, and datasets directly from their original sources.
I typically reference a variety of sources and update my posts whenever new or related information becomes available. For this particular post, the primary source was Google Advanced Data Analytics Professional Certificate.