The term ‘covariance’ between two random variables, defines the product of the distances of each random variable from their mean or from their expected values.
Cov(X, Y) = E [(X – E[X]) (Y – E[Y])]
Simpler way to explain this is, that it’s saying how much they vary together.
Before we continue let’s try to get a little bit of intuition about what the covariance is trying to tell us:
Let’s say X is above its mean when Y is below its mean: So one instantiation of the random variables (we sample once from the universe) and we get X=1 and Y=3. And let’s say we knew ahead of time that the expected value of X is 0 and the expected value of Y is 4.
Now we don’t know the entire covariance, we only have one sample here of this random variable. But what does it mean?
Cov(X,Y) = (1-0)(3-4) = -1
It tells us (at least for this sample) that we sampled the random variables X and Y, X was above its expected value when Y was below its expected value, and if we kept doing this, let’s say for the entire population this happened, then it would make sense that they have a negative covariance. When one goes up, the other one goes down. When one goes down, the other one goes up.
If they both go up together, they would have a positive covariance or they both go down together. And the degree to which they do it together will tell us the magnitude of the covariance.
Now let’s try to connect this definition of covariance above to everything we’ve been doing with the least-squares regression before.
Let’s rewrite that definition of covariance above:
= E [ XY – X E[Y] – E[X] Y + E[X] E[Y] ]
Expected value, in a lot of context, we could view as just the arithmetic mean. Or, in a continuous distribution we could see it as a probability weighted sum or probability weighted integral.
= E[XY] – E[X E[Y]] – E[E[X] Y] + E[E[X] E[Y]]
Remember, E[E[X]] = E[X]
= E[XY] – E[Y] E[X] – E[X] E[Y] + E[X] E[Y]
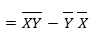
= E[XY] – E[Y] E[X]
Note that, the expected value of XY can be approximated by the sample mean of XY.
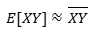
What can the covariance of two random variables be approximated by?
Previously we got the below equation when we tried to get the slope of the regression line, so the above definition is the numerator of it.
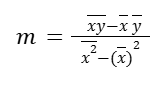
If we assume that the points that we have were a sample from an entire universe of possible points, we could say that we are approximating the slope of the regression line. (that’s why in some books, we can see a little hat notation above the m, saying that we’re approximating the population’s regression line from a sample of it)
Now we can write:
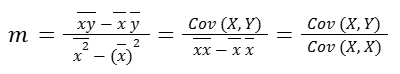
Remember that the covariance of a random variable with itself is just the variance* of that random variable. So the slope of our regression line can be viewed as the covariance of two random variables over the variance of X (independent random variable).
* We can verify that for ourselves:
When we change Y to X in the equation:
Cov(X, Y) = E [(X – E [X]) (Y – E [Y])],
it becomes:
Cov(X, X) = E [(X – E [X]) (X – E [X])] = E [(X – E [X])2]
And that’s our definition of variance.
Disclaimer: Like most of my posts, this content is intended solely for educational purposes and was created primarily for my personal reference. At times, I may rephrase original texts, and in some cases, I include materials such as graphs, equations, and datasets directly from their original sources.
I typically reference a variety of sources and update my posts whenever new or related information becomes available. For this particular post, the primary source was Khan Academy’s Statistics and Probability series.