Normal distribution problems: Empirical rule
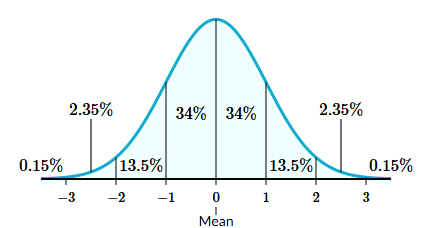
The empirical rule (also called the “68 – 95 – 99.7 rule”) is a guideline for how data is distributed in a normal distribution. The rule states that (approximately):
- 68% of the data points will fall within 1 standard deviation of the mean.
- 95% of the data points will fall within 2 standard deviations of the mean.
- 99.7% of the data points will fall within 3 standard deviations of the mean.
In a standard normal distribution:
- The mean is 0, and the standard deviation is 1.
- It has a bell shape.
- The mean and median are equal.
µ = 0
σ = 1
A sample reading of the areas:
- The fraction of data below 1: 0.84
- The fraction of data below -1: 0.16
- The fraction of data above 2: 0.025

A z-score can apply to a non-normal distribution too.
Normal distribution calculations
Standard normal table for proportion below, above, or between values
For a value of z-score rather than 1, 2, or 3 we can look at the z table to get what proportion is less than that amount in a normal distribution.
Finding z-score for a percentile (normal calculations in reverse)
In any normal distribution, we can find the z-score that corresponds to some percentile rank. If we’re given a particular normal distribution with some mean and standard deviation, we can use that z-score to find the actual cutoff for that percentile.
A sample event that we’d like to use such calculation might be:
The distribution of resting pulse rates of all students at a High School was approximately normal with mean 80 beats per minute and standard deviation 9 beats per minute.
Q1: Only students whose resting pulse rates are in the lower 40% are eligible to join the weight-lifting club. What is the maximum resting pulse rate for students who are eligible to join the weight-lifting club?
OR
Q2: The school plans to provide additional screening to students whose resting pulse rates are in the top 30% of the students who were tested. What is the minimum resting pulse rate for students who will receive additional screening?
Let’s answer the last one: We can use z-table to say for what z-score is 70% of the distribution less than that. And we can take that z-score and use the mean and the standard deviation to come up with an actual number.
The lowest z-score that gets us across that 70 % threshold is at 0.7019 and that is a z-score of 0.53.
So the answer would be 80 + 0.53 * 9 = 84.77 = ~85 beats per minute
Deep definition of the normal distribution
The normal distribution is arguably the most important concept in statistics. Almost everything we do in inferential statistics, which is essentially making inferences based on data points, is to some degree, based on the normal distribution.
With the binomial distribution, we can ask: What is the probability of getting -say- a 7? And we can just look at the histogram or the bar chart and find the probability.
But in a continuous probability density function, we can’t ask what is the probability of getting a 7. We have to ask what is the probability of getting -say- a 4.5 and a 7.5. We have to give it some range.
Then, the probability isn’t given just by reading the graph, but given by the area under the curve.
Normal distribution excel exercise
Central limit theorem – If we have many independent trials (approaching infinity), even though the distributions of each of those trials might have been non-normal, the distribution of all those trials approaches the normal distribution.
That’s why it’s such a good distribution to assume a lot of underlying phenomenon, like if we’re trying to model weather patterns or drug interactions.
Disclaimer: Like most of my posts, this content is intended solely for educational purposes and was created primarily for my personal reference. At times, I may rephrase original texts, and in some cases, I include materials such as graphs, equations, and datasets directly from their original sources.I typically reference a variety of sources and update my posts whenever new or related information becomes available. For this particular post, the primary source was Khan Academy’s Statistics and Probability series.
